


Three years ago, I was drowning in spreadsheets. Yellow cards from Serie A mixed with red cards from the Championship, referee stats scattered across seventeen different browser tabs, and a notebook filled with observations that made sense at 2 AM but looked like hieroglyphics the next morning. My attempt at building a comprehensive card statistics database had turned into digital chaos. Then I met a professional punter at a conference who showed me his system – clean, organized, profitable. That twenty-minute conversation changed everything about how I approach football card data.
The difference between casual card betting and professional success isn’t luck or insider information. It’s data – specifically, knowing how to collect it, organize it, analyze it, and most importantly, spot the patterns that others miss. This guide shares everything I’ve learned about building and maintaining a football card statistics database that actually generates betting value rather than just consuming your time.
Building Comprehensive Stats Databases
Starting a card statistics database feels overwhelming because you’re essentially trying to capture the disciplinary story of hundreds of matches across multiple leagues. The key is starting small and scaling systematically. I began with just the Premier League, tracking only yellow cards for one month. That foundation taught me what worked before I expanded to multiple leagues and comprehensive metrics.
Your database architecture matters more than you might think. A poorly structured database becomes unwieldy after a few hundred entries, making analysis painful and insights invisible. I learned this the hard way when my first attempt required manually updating dozens of interconnected sheets every match day. Now, my structure follows a hierarchical model that scales effortlessly.
The core tables you need:
- Matches table: Date, home team, away team, competition, referee, final score
- Cards table: Match ID, minute, player, team, card type, reason (if available)
- Referee table: Name, country, experience level, appointment date
- Team table: Name, league, manager, tactical style
- Player table: Name, position, team, temperament rating

The relationships between these tables create the magic. When you link match data to card data to referee data, patterns emerge. You discover that Mike Dean shows 23% more cards in London derbies than his average. You notice that Atletico Madrid’s card count correlates inversely with their possession percentage. These insights come not from individual data points but from the connections between them.
Data entry consistency determines database value. “Manchester United” and “Man Utd” might seem obviously the same to you, but they’re different to your database. I use standardized naming conventions: full official names for teams, UEFA’s referee name format, and ISO date formats. This consistency enables accurate analysis months or years later when you’ve forgotten the specific match details.
Automation transformed my database from a time-consuming hobby to a professional tool. Python scripts now populate 80% of my data automatically. Web scraping pulls match results, team lineups, and basic stats. APIs provide referee appointments and card details. I spend perhaps two hours weekly on data management compared to the fifteen hours my manual system required.
League-by-League Card Statistics
The beauty of comprehensive card tracking reveals itself when you analyze leagues comparatively. La Liga’s reputation for cards proves justified – averaging 5.4 yellows and 0.3 reds per match. But dig deeper, and you find that 60% of these cards come from just eight teams. Barcelona and Real Madrid, despite dominating possession, receive the fewest cards per match. Meanwhile, Getafe has turned tactical fouling into an art form, averaging 3.1 cards per match themselves.
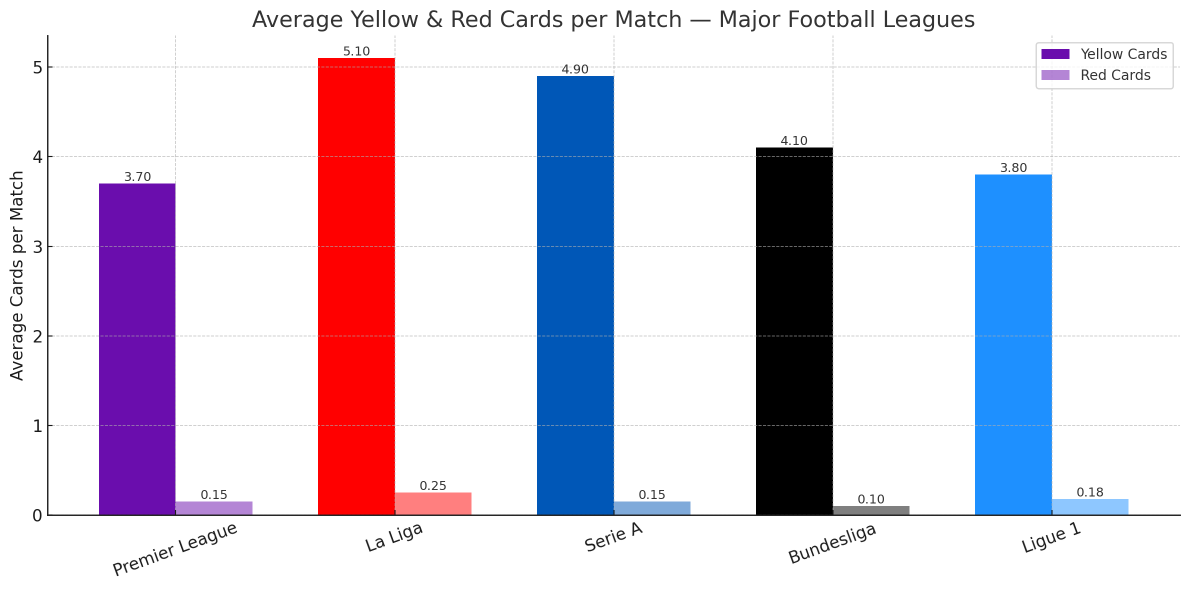
The Premier League tells a different story entirely. At 3.2 yellows per match (down from 3.8 five years ago), it’s become the least card-heavy major league. But this average masks enormous variance. Burnley under Sean Dyche averaged 2.4 cards per home match but 1.6 away – the opposite of league trends. Understanding these team-specific patterns within league contexts creates betting edges.
Serie A fascinates me because its card distribution differs fundamentally from other leagues. While averaging 4.8 cards per match (middle of the pack), Serie A produces 40% more straight red cards than any other top league. Italian referees seem less inclined to show yellows for minor infractions but quicker to brandish reds for serious offenses. This creates a bimodal distribution where matches either feature very few cards or explode into disciplinary chaos.
The Bundesliga’s efficiency extends to its disciplinary record. German teams average just 2.9 cards per match, the lowest among major leagues. But contextual factors matter enormously here. Friday night matches average 3.4 cards, while Sunday afternoon matches drop to 2.5. The fixture scheduling, unique to Bundesliga, creates predictable patterns for those paying attention.
Lower leagues provide untapped opportunity for card statistics analysis. The Championship averages 4.1 cards per match, but the real value lies in its consistency. While Premier League card totals vary wildly based on referee appointment and match importance, Championship matches reliably produce 3-5 cards regardless of context. This predictability, combined with bookmaker assumptions that lower leagues are more volatile, creates consistent value.
Hidden gems in lesser-tracked leagues:
- Scottish Premiership: Old Firm matches average 6.2 cards versus 3.1 for other fixtures
- Eredivisie: Dutch refs show 65% of cards after the 70th minute
- Liga Portugal: Away teams receive 71% of all red cards, highest in Europe
- MLS: Playoff matches average 40% fewer cards than regular season despite higher intensity
Team Disciplinary Records Analysis
Every team has a disciplinary DNA that goes beyond simple averages. Atletico Madrid’s reputation for aggressive play seems justified at first glance – they average 2.8 cards per match. But deeper analysis reveals something fascinating: they average 3.4 cards when trailing but just 1.9 when leading. Diego Simeone has coached his team to use tactical fouling strategically rather than constantly.
Manchester City presents an interesting case study in disciplinary evolution. Under Pep Guardiola, they’ve transformed from averaging 1.9 cards per match in his first season to just 1.2 cards currently. This isn’t about playing less aggressively; it’s about tactical fouling efficiency. City commits fouls in less dangerous areas, avoiding bookings while still disrupting opposition attacks.
Home versus away splits reveal more than you might expect. Leeds United under Marcelo Bielsa averaged 2.9 cards at Elland Road but 3.7 on the road. Their high-intensity pressing style combined with hostile crowds away from home created perfect conditions for bookings. Conversely, Arsenal averages fewer cards away (1.8) than at home (2.1), perhaps because they’re more cautious when not enjoying Emirates Stadium support.
Manager influence on team discipline proves significant but often delayed. When Antonio Conte arrived at Tottenham, their card average jumped from 2.1 to 2.6 within three months as his demanding style created frustration. When Thomas Tuchel replaced him, that number dropped to 1.8 as the squad settled into a more controlled approach. These transitions create temporary inefficiencies that sharp bettors exploit.
Derby matches deserve special attention in your database. Expected cards in standard matches don’t apply when Liverpool faces Everton or Milan meets Inter. The Merseyside derby averages 5.1 cards, 80% above Liverpool’s normal average and 95% above Everton’s. Building a separate “derby factor” into your calculations prevents underestimating these matches.
Factors influencing team card averages:
- Tactical style: Pressing teams average 0.4 more cards than possession-based teams
- League position: Teams in relegation zone average 0.6 more cards in final ten matches
- European competition: Teams playing Thursday average 0.3 fewer cards the following Sunday
- Manager tenure: New managers see 0.5 card increase in first five matches
Referee Pattern Recognition
Understanding referee tendencies provides perhaps the single biggest edge in card betting. Michael Oliver shows an average of 3.8 cards per Premier League match, but that jumps to 5.2 in matches between top-six teams. He’s consistent in his threshold for what constitutes a booking but less tolerant of dissent from elite players who think they’re above reproach.

Some referees display surprising consistency. Anthony Taylor has shown between 3.4 and 3.6 cards per match for four consecutive seasons. Others vary wildly – Craig Pawson ranged from 2.1 to 5.8 cards per match last season, making him effectively unpredictable. I track both average and standard deviation for each referee, preferring bets involving consistent officiating.
European competitions introduce additional complexity because referees come from different national traditions. Spanish referees average 5.1 cards in Champions League matches, English referees 2.9, and German referees 3.3. These national patterns persist even in international matches, suggesting deeply ingrained officiating philosophies rather than league-specific instructions.
The experience factor matters more than you’d think. Referees in their first season at the top level show 0.7 more cards per match than those with five-plus years of experience. They’re proving themselves, establishing authority, and less confident in their judgment. By their third season, most referees settle into consistent patterns that your database can track reliably.
Match context dramatically affects referee behavior. The same referee who averages 3.2 cards in mid-table matches shows 4.6 in relegation battles and 4.1 in title deciders. High-stakes matches feature heightened emotions, more tactical fouling, and referees under intense scrutiny. I adjust expected cards by 20-30% in these situations.
Referee metrics worth tracking:
- Cards per match average and standard deviation
- Cards per foul ratio (strictness indicator)
- Home versus away card distribution (bias indicator)
- Cards before versus after 60th minute (tolerance pattern)
- Red card frequency (threshold for serious offenses)
- VAR overturn rate (consistency with technology)
Data Visualization Techniques
Raw numbers tell stories, but visualizations make them obvious. A heat map showing when cards typically occur reveals that 38% of all bookings happen between the 70th and 85th minutes. This isn’t random – tired legs lead to mistimed tackles, and losing teams become desperate. Betting on cards in specific time windows exploits this pattern.
Trend lines help identify genuine changes versus random variance. When a team’s card average drops over fifteen matches, that’s signal. When it drops over three matches, that’s noise. My visualization includes rolling averages (10-match windows) that smooth out outliers while remaining responsive to real changes.
Correlation matrices revealed unexpected relationships in my data. Team possession percentage correlates negatively with cards received (-0.62 correlation), but only slightly with cards drawn (0.31 correlation). This asymmetry means possession-dominant teams like Manchester City receive fewer cards but don’t necessarily cause opponents to receive more cards.
Distribution charts expose opportunities bookmakers miss. Card totals follow a skewed distribution, not a normal one. Most matches feature 2-4 cards, but the long tail of 7+ card matches is fatter than bookmakers assume. This creates value in over bets when conditions (derby matches, strict referees, aggressive teams) suggest outlier potential.
Interactive dashboards revolutionized my pre-match analysis. Instead of manually checking dozens of statistics, I input the match details and immediately see:
- Historical head-to-head card averages
- Referee statistics for similar fixtures
- Team form charts for discipline
- Player suspension risks
- Time-based card probability distributions
The power of visualization extends beyond personal analysis. When explaining betting rationale to staking partners, a clean chart showing referee tendencies carries more weight than paragraphs of explanation. Visual evidence of edges convinces skeptics and clarifies thinking for believers.
Tool Recommendations for Analysis
The ecosystem of tools for card statistics has exploded in recent years. FootyStats remains my foundation for historical data, offering granular card statistics going back five seasons. Their referee sections are unmatched, showing cards per match, cards per foul ratios, and even minute-by-minute booking distributions.
Understat might focus on expected goals, but their pressure maps indirectly predict card likelihood. When I see sustained pressure in dangerous areas, cards inevitably follow. Combining their data with traditional card statistics creates a more complete picture of match dynamics.
For live tracking, SofaScore excels with their incident timeline and momentum tracker. Watching momentum swing without goals often precedes booking clusters as frustrated teams resort to tactical fouling. Their player ratings also correlate with card likelihood – players rated below 6.5 are 40% more likely to receive cards.

Building custom tools sounds daunting but proves simpler than expected. Python with pandas handles data manipulation brilliantly. A hundred lines of code can clean data, calculate averages, and identify outliers faster than hours of manual work. BeautifulSoup scrapes websites for data not available through APIs. Even basic programming knowledge unlocks powerful analysis capabilities.
Google Sheets with Apps Script provides a middle ground between manual tracking and full programming. Custom functions calculate referee averages, team form, and player risks automatically. Triggers update data overnight, so I wake up to fresh statistics. The learning curve is gentle, and countless tutorials exist online.
The most underutilized tool might be simple note-taking. I maintain a match notes database where I record observations not captured in statistics. “Referee seemed influenced by crowd after controversial decision” or “Team captain calmed teammates after early booking” provide context that pure numbers miss. These qualitative insights, combined with quantitative data, create true understanding.
Common Mistakes in Data Collection
The biggest mistake in card statistics is treating all cards equally. A professional yellow for stopping a counter-attack tells a different story than a petulant booking for dissent. One suggests tactical discipline, the other emotional volatility. My early databases failed to capture this distinction, limiting their predictive value.
Sample size seduction kills many promising databases. Yes, that referee showed 8 cards in his last match, but if he’s only officiated three matches this season, that tells you nothing meaningful. I require minimum samples of 10 matches for referees, 15 for teams, and 20 for players before considering averages reliable.
Failing to account for score effects corrupts card statistics. Teams trailing late commit more fouls, desperate for possession. Teams leading comfortably ease off, avoiding unnecessary bookings. Raw card averages without considering match state miss this crucial context. I track cards in five match states: drawing, one goal ahead/behind, two goals ahead/behind.
Data quality issues that corrupt analysis:
- Inconsistent naming (Manchester Utd vs Man United vs MUFC)
- Missing data treated as zeros instead of nulls
- Mixing competitions without adjustment factors
- Ignoring international breaks’ effect on form
- Failing to remove outliers (abandoned matches, unusual circumstances)
The recency bias trap catches even experienced analysts. Last week’s 9-card thriller doesn’t predict this week’s match. I use weighted averages that balance recent form with longer-term trends, preventing overreaction to outliers while remaining responsive to genuine changes.
Not backing up data remains surprisingly common. I learned this lesson painfully when a corrupted file destroyed six months of meticulously collected statistics. Now I maintain triple redundancy: local copies, cloud storage, and version-controlled repositories. The few minutes weekly this requires saves potential disaster.
Apply strong individual booking strategies.
Football Card Stats: How to Use Data for Better Betting Decisions

Building a comprehensive football card statistics database transforms betting from gambling to investing. The patterns hidden in properly collected and analyzed data provide edges invisible to casual punters relying on instinct or basic averages. Every hour spent improving your database returns itself many times over through better betting decisions.
Start small with one league, tracking basic statistics for every match. Expand gradually, adding leagues, metrics, and complexity as your system proves itself. Remember that perfect data doesn’t exist – good enough data acted upon beats perfect data perpetually refined.
The journey from scattered spreadsheets to systematic database took me three years of iteration. Mistakes taught more than successes. Each refinement, whether adding a new metric or discovering a correlation, improved results marginally. These marginal gains compound into substantial edges over time.
Modern tools make sophisticated analysis accessible to anyone willing to learn. You don’t need a mathematics degree or programming expertise. Curiosity, consistency, and dedication to improvement suffice. The same referee showing cards today will officiate next week – patterns persist for those tracking them.
Your database becomes your edge. While others rely on bookmaker odds or tipster recommendations, you’ll have data-driven insights from your personal analysis. This independence from external sources provides both better results and deeper satisfaction from successful bets.
The future belongs to those who embrace data. As betting markets become more efficient, edges shrink for those relying on intuition. But for those building comprehensive databases, analyzing patterns systematically, and acting on data-driven insights, opportunities multiply. Your football card statistics database isn’t just a tool – it’s your pathway to long-term betting success.
Build your own system alongside card bet.
